
- Any incidents & their resolution status.
- Any scheduled maintenance (particularly if there may be disruption to the quality of the service).
- Significant reliability metrics, particularly those referenced in SLAs.
Internally, these can be reported and tracked using tools such as FreshDesk, Nagios, AWS Cloudwatch dashboards (for an AWS hosted system), Azure Monitor, and so on.
Client (& external users) require a more coarse grained view. Atlassian Status Page is a convenient and easily maintainable tool for distilling and distributing this information, and has some advantages:
- It can be managed by less technical and more "client-facing" members of your team.
- One less system to monitor and maintain, rather than any self-hosted alternative.
- Only metrics that you decide to publish are exposed to the outside world (compared to a public AWS Dashboard).
Status page does not have a native integration with AWS Cloudwatch, so this article will outline how to pull relevant metrics from CloudWatch and publish them to Status page.
Pre-requisites:
- Status page account.
- A system running in AWS, reporting metrics and logs to CloudWatch.
Overview
- Define the metric in Status Page.
- Generate an API key in Status Page.
- Set up a Lambda function in AWS to read the metrics.
- Set up a trigger in EventBridge to fire the Lambda on a schedule.
In Detail
Step 1. Define the metric

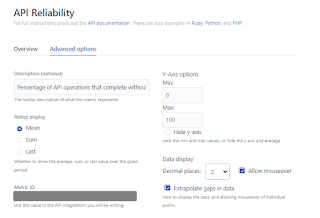
Take note of the Metric Id, you will need this later.
Step 2. Generate an API Key for the Page
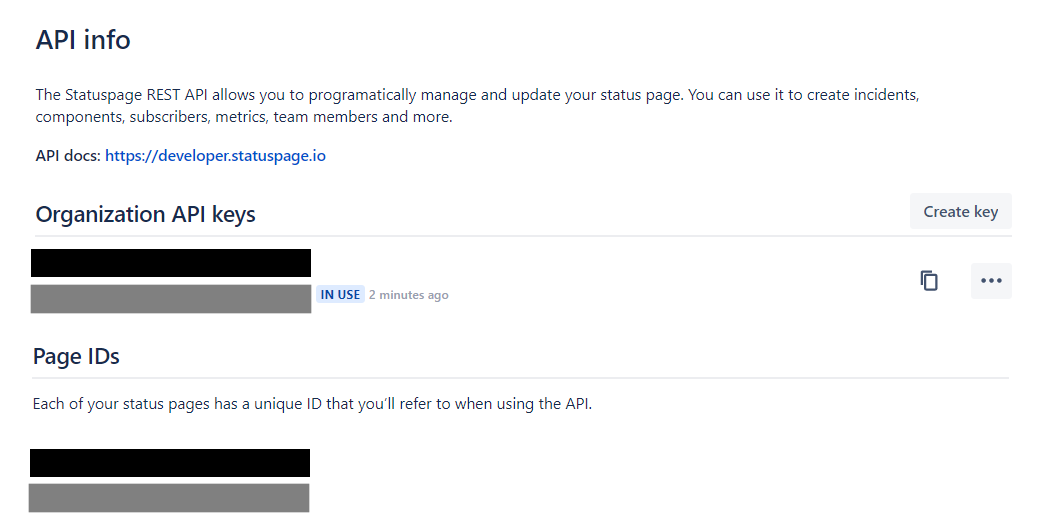
Take note of the API key and the Page Id, you will need these later.
Step 3. Set up a Lambda function
Since we will be running the lambda frequently and it only needs access to basic AWS capability, let's build it in Node.js. It only requires the minimum of memory (i.e. 128MB). However, it can take a few seconds to run, so it's best to adjust the timeout to 10sec.
Set up the policy for the lambda function
Allow:
- Creating the log group and log events for the lambda.
- Reading metrics
- Reading Cloudwatch logs
- Running queries against Cloudwatch logs
{
    "Version": "2012-10-17",
    "Statement": [
        {
            "Sid": "VisualEditor0",
            "Effect": "Allow",
            "Action": [
                "logs:GetQueryResults",
                "cloudwatch:GetMetricData",
                "logs:StopQuery",
                "cloudwatch:GetMetricStatistics"
            ],
            "Resource": "*"
        },
        {
            "Sid": "VisualEditor1",
            "Effect": "Allow",
            "Action": [
                "logs:GetLogEvents",
                "logs:CreateLogGroup"
            ],
            "Resource": [
                "arn:aws:logs:<region>:<account>:*"
            ]
        },
        {
            "Sid": "VisualEditor2",
            "Effect": "Allow",
            "Action": [
                "logs:CreateLogStream",
                "logs:PutLogEvents"
            ],
            "Resource": "arn:aws:logs:<region>:<account>:log-group:/aws/lambda/<lambda name>:*"
        },
        {
            "Sid": "VisualEditor3",
            "Effect": "Allow",
            "Action": [
                "logs:StartQuery",
                "logs:FilterLogEvents",
                "logs:GetLogGroupFields"
            ],
            "Resource": "arn:aws:logs:*:<account>:log-group:*"
        }
    ]
}
Import the libraries and set up the basic framework for your lambda
const aws = require('aws-sdk');
aws.config.update({region: '<region>'});
const cwlogs = new aws.CloudWatchLogs({apiVersion: '2014-03-28'});
const cw = new aws.CloudWatch({apiVersion: '2010-08-01'});
const https = require('https');

exports.handler = async (event, context) => {
    const promise = new Promise(function(resolve, reject) {
        var apiKey = '<API Key for Status page>';
        var pageId = '<Your PageId>';


    });

    return promise;
};
Reading a CloudWatch metric
This is two step process:
- Construct the parameters for the CloudWatch query.
- Send the request to CloudWatch and handle the response with the metric value.
In the example below, we are fetching the average number of requests served by a load balancer for the past 3 minutes.
function initiateMetricQuery(){
    var metricQueryParams = {
        EndTime: new Date(Date.now()),
        MetricName: 'RequestCount',
        Namespace: 'AWS/ApplicationELB',
        StartTime: (new Date(Date.now() - (3 * 60 * 1000))),
        Period: (3 * 60),
        Dimensions: [{
          Name: 'LoadBalancer',
          Value: <load balancer name and id>
        }],
        Statistics: ['Average'],
        Unit: 'Count'
      };

  cw.getMetricStatistics(metricQueryParams, function(err, data) {
          if (err) {
            console.log("Error", err);
          } else {
            var statName = metricQueryParams.Statistics[0];
            var metricValue = 0;
            if (data.Datapoints.length > 0){
              metricValue = data.Datapoints.sort((a,b) => (a[statName]>b[statName]) ? 1 : -1)[0][statName];
            }
            console.log("Success", metricValue);
            //TODO do something with the metric value
          }
        });
}
Sending the metric value to the Status Page API
For this you will need the following values from earlier:
- Your API key
- The PageId of the Status page
- The Id of the metric
function submitMetric(metricId, metricValue, pageId, apiKey) {

  var apiBase = 'https://api.statuspage.io/v1';
  var url = apiBase + '/pages/' + pageId + '/metrics/' + metricId + '/data.json';
  var authHeader = { 'Authorization': 'OAuth ' + apiKey };
  var options = { method: 'POST', headers: authHeader };
  var epochInSeconds = Math.floor(new Date() / 1000);

  var data = {
    timestamp: epochInSeconds,
    value: metricValue,
  };

  var request = https.request(url, options, function (res) {
    if (res.statusMessage === "Unauthorized") {
      const genericError =
        "Error encountered. Please ensure that your page code and authorization key are correct.";
      return console.error(genericError);
    }
    res.on("data", function () {
      console.log("Submitted " + JSON.stringify({ data: data, destination: url }));
    });
    res.on("end", function () {
      console.log("Completed " + metricId + " : " + metricValue);
    });
    res.on("error", (error) => {
      console.error("Error caught: ${error.message} " + JSON.stringify({ destination: url, data: data }));
    });
  });

  request.end(JSON.stringify({ data: data }));
}
Reading from CloudWatch logs
Reading from CloudWatch logs is slightly more involved than reading a CloudWatch metric. Since a log query can take some time to complete, the initial request returns with an id, we then need to poll for the response until the query has completed.
For this we have a three step process:
- Construct the parameters for the log query.
- Send the request to CloudWatch.
- Poll for results.
In the example below, we are fetching the minimum execution time for a process in the past 3 minutes.
function initiateCwLogQuery(){
    var end = Date.now();
    var start = (new Date(Date.now() - (3 * 60 * 1000))).getTime();

    var logQueryParams = {
        endTime: end,
        logGroupName: '<cloudwatch log group name>',
        queryString: 'stats min(<structured logging field name>) as MinElapsed by bin(3m) as Period | filter @message like /<filter criteria>/ | sort Period desc',
        startTime: start
    };

  cwlogs.startQuery(logQueryParams, function(err, data) {
          if (err) {
            console.log('Error', err);
          } else {
            getCwLogQueryResults(data.queryId);
          }
        });
};


function getCwLogQueryResults(queryId){
  var queryResultsParams = { queryId: queryId };

  cwlogs.getQueryResults(queryResultsParams, function(err,qdata){
        if (err) {
        console.log('Log query result Error', err);
        } else {

          if (qdata.status != 'Complete'){
                  setTimeout(function(queryId) {
                  getCwLogQueryResults(queryId);
                  }, 25, queryId);
          } else {

            var ts = Date.now();
            var metricValue = 0;

            if (qdata.results.length > 0){
                ts = new Date(qdata.results[0].filter(res => res.field == 'Period')[0].value).getTime();
                metricValue = qdata.results[0].filter(res => res.field == 'MinElapsed')[0].value;
            }

            var metric = {
                timestamp: ts,
                value: metricValue
              };
            console.log( JSON.stringify(metric));
            //TODO do something with the metric value
          }
        }
    });
}
Bringing it all together
Let's put it all together. We will collect and report two metrics:
- API response time: read from a statistical query of structured logs
- API reliability: calculated from two metrics
- The number of HTTP 5xx errors reported by the load balancer
- The total number of HTTP requests reported by the load balancer
const aws = require('aws-sdk');
aws.config.update({region: 'eu-west-1'});
const cwlogs = new aws.CloudWatchLogs({apiVersion: '2014-03-28'});
const cw = new aws.CloudWatch({apiVersion: '2010-08-01'});
const https = require('https');

exports.handler = async (event, context) => {
    const promise = new Promise(function(resolve, reject) {
        var apiKey = '<api key for status page>';
        var pageId = '<your page id>';

        // start the log query first, 'cos we have to poll for results
        var apiResponseTimeMetricId = '<a metric id>';
        initiateCwLogQuery(apiResponseTimeMetricId, pageId, apiKey);

        // collect load balancer metrics
        var requestCount = 0;
        var errorCount = 0;

        initiateRequestCountMetricQuery((count) => {
          requestCount = count;
          initiateRequestErrorCountMetricQuery((errCount)  => {
            errorCount = errCount;
            submitApiReliability(requestCount, errorCount, pageId, apiKey);
          });
        });
    });

    return promise;
};

function submitApiReliability(requestCount, errorCount, pageId, apiKey)
{
   // calculate and submit the metric
  var reliabilityPct = calcApiReliability(errorCount, requestCount);
  var apiReliabilityPctMetricId = '<a metric id>';
  submitMetric(apiReliabilityPctMetricId, reliabilityPct, pageId, apiKey);
}


function initiateRequestCountMetricQuery(fnReqCount){
    var metricQueryParams = {
        EndTime: new Date(Date.now()),
        MetricName: 'RequestCount',
        Namespace: 'AWS/ApplicationELB',
        StartTime: (new Date(Date.now() - (3 * 60 * 1000))),
        Period: (3 * 60),
        Dimensions: [{
          Name: 'LoadBalancer',
          Value: '<load balancer name and id>'
        }],
        Statistics: ['Average'],
        Unit: 'Count'
      };

  cw.getMetricStatistics(metricQueryParams, function(err, data) {
          if (err) {
            console.log('Error', err);
          } else {
            var statName = metricQueryParams.Statistics[0];
            var metricValue = 0;
            if (data.Datapoints.length > 0){
              metricValue = data.Datapoints.sort((a,b) => (a[statName]>b[statName]) ? 1 : -1)[0][statName];
            }
            fnReqCount(metricValue);
          }
        });
}

function initiateRequestErrorCountMetricQuery(fnErrCount){
    var metricQueryParams = {
        EndTime: new Date(Date.now()),
        MetricName: 'HTTPCode_Target_5XX_Count',
        Namespace: 'AWS/ApplicationELB',
        StartTime: (new Date(Date.now() - (3 * 60 * 1000))),
        Period: (3 * 60),
        Dimensions: [{
          Name: 'LoadBalancer',
          Value: '<load balancer name and id>'
        }],
        Statistics: ['Average'],
        Unit: 'Count'
      };

  cw.getMetricStatistics(metricQueryParams, function(err, data) {
          if (err) {
            console.log('Error', err);
          } else {
            var statName = metricQueryParams.Statistics[0];
            var metricValue = 0;
            if (data.Datapoints.length > 0){
              metricValue = data.Datapoints.sort((a,b) => (a[statName]>b[statName]) ? 1 : -1)[0][statName];
            }
            fnErrCount(metricValue);
          }
        });
}


function submitMetric(metricId, metricValue, pageId, apiKey) {

  var apiBase = 'https://api.statuspage.io/v1';
  var url = apiBase + '/pages/' + pageId + '/metrics/' + metricId + '/data.json';
  var authHeader = { 'Authorization': 'OAuth ' + apiKey };
  var options = { method: 'POST', headers: authHeader };
  var epochInSeconds = Math.floor(new Date() / 1000);

  var data = {
    timestamp: epochInSeconds,
    value: metricValue,
  };

  var request = https.request(url, options, function (res) {
    if (res.statusMessage === "Unauthorized") {
      const genericError =
        "Error encountered. Please ensure that your page code and authorization key are correct.";
      return console.error(genericError);
    }
    res.on("data", function () {
      console.log("Submitted " + JSON.stringify({ data: data, destination: url }));
    });
    res.on("end", function () {
      console.log("Completed " + metricId + " : " + metricValue);
    });
    res.on("error", (error) => {
      console.error("Error caught: ${error.message} " + JSON.stringify({ destination: url, data: data }));
    });
  });

  request.end(JSON.stringify({ data: data }));
}

function initiateCwLogQuery(metricId, pageId, apiKey){
    var end = Date.now();
    var start = (new Date(Date.now() - (3 * 60 * 1000))).getTime();

    var logQueryParams = {
        endTime: end,
        logGroupName: '<cloudwatch log group name>',
        queryString: 'stats min(<structured logging field name>) as MinElapsed by bin(3m) as Period | filter @message like /<filter criteria>/ | sort Period desc',
        startTime: start
    };

  cwlogs.startQuery(logQueryParams, function(err, data) {
          if (err) {
            console.log('Error', err);
          } else {
            getCwLogQueryResults(data.queryId, metricId, pageId, apiKey);
          }
        });
}


function getCwLogQueryResults(queryId, metricId, pageId, apiKey){
  var queryResultsParams = { queryId: queryId };

  cwlogs.getQueryResults(queryResultsParams, function(err,qdata){
        if (err) {
        console.log('Log query result Error', err);
        } else {

          if (qdata.status != 'Complete'){
                  setTimeout(function(queryId) {
                  getCwLogQueryResults(queryId, metricId, pageId, apiKey);
                  }, 25, queryId);
          } else {

            var ts = Date.now();
            var metricValue = 0;

            if (qdata.results.length > 0){
                ts = new Date(qdata.results[0].filter(res => res.field == 'Period')[0].value).getTime();
                metricValue = qdata.results[0].filter(res => res.field == 'MinElapsed')[0].value;
            }

            var metric = {
                timestamp: ts,
                value: metricValue
              };
            console.log( JSON.stringify(metric));
            submitMetric(metricId, metricValue, pageId, apiKey);
          }
        }
    });
}

function calcApiReliability(failingApiCallCount, totalApiCallCount){

  if (totalApiCallCount == 0)
    return 100;
  return ((totalApiCallCount - failingApiCallCount) / totalApiCallCount) * 100;
}
Step 4. Set up a trigger in EventBridge to fire the Lambda on a schedule.
We need an EventBridge rule that will call our metric collection lambda at a regular rate which is less than the minimum duration metrics in the Status page (i.e. 5min).
- Rule Detail:
- Name - something meaningful: e.g. status-metric-collector
- Event bus: default
- Rule type: Schedule
- Schedule Pattern:
- Run at a regular rate
- Rate expression
- Value: 3
- Unit: Minutes
- Target
- Target type: AWS Service: Lambda function
- Function: <select your lambda>
- Version: Default
- Additional settings (you can ignore this section)
- Tags: (you can ignore this section)
Make sure the rule is enabled. If you return to Monitor tab on the Lambda console for your lambda, you should be able to see the invocations, and the numbers will begin to appear on your Atlassian Status page.
Comments
Post a Comment